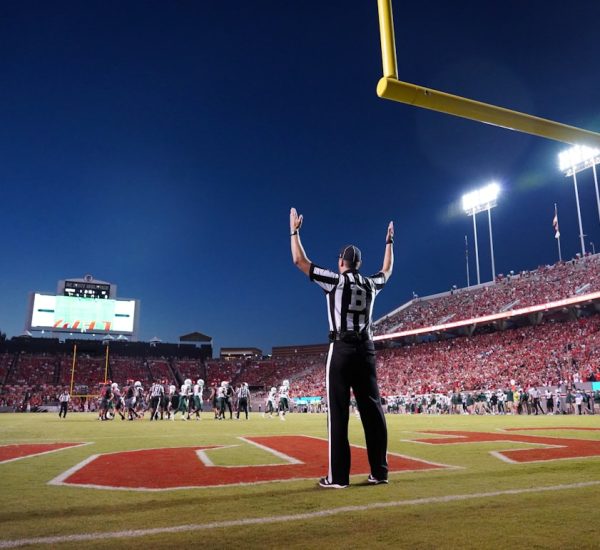
The Baltimore Ravens and the Buffalo Bills have developed one of the most compelling interconference rivalries in the NFL over the last decade. Whenever these two AFC powerhouses meet, fans are treated to a strategic battle between elite quarterbacks, hard-hitting defenses, and explosive playmakers. Each matchup tends to carry playoff implications, making the statistical breakdown of their encounters especially fascinating.
TLDR: The Baltimore Ravens vs Buffalo Bills matchups consistently feature elite quarterback play, aggressive defensive schemes, and tightly contested scorelines. Statistical trends highlight dynamic rushing from Baltimore and high-volume passing from Buffalo. Turnovers and third-down efficiency often determine the winner. Overall, these games are defined by balance, adaptability, and star performances under pressure.
Historical Overview of Ravens vs Bills Matchups
The Ravens and Bills have met multiple times since the Ravens franchise was established in 1996. While not traditional division rivals, their meetings have frequently occurred during high-stakes regular season clashes and postseason games.
Historically, game outcomes between the two teams have often been decided by:
- Turnover differential
- Red zone efficiency
- Quarterback passer rating
- Time of possession
The Bills have leaned heavily on their passing game in recent seasons, led by quarterback Josh Allen. Meanwhile, the Ravens have built their identity around a dominant ground attack and dual-threat quarterback Lamar Jackson. This stylistic contrast makes their statistical battles especially compelling.
Quarterback Performance Comparison
One of the most discussed aspects of any Ravens vs Bills matchup is the duel between franchise quarterbacks. Both Lamar Jackson and Josh Allen bring unique skill sets that shape their teams’ offensive strategies.

Lamar Jackson Stats Snapshot
- Completion Percentage: Typically ranges between 63–67%
- Passing Yards per Game vs Bills: Approximately 180–240 yards
- Rushing Yards vs Bills: Often exceeds 50 yards per game
- Total Touchdowns (average matchup): 1–3 combined passing and rushing
Jackson’s impact extends beyond traditional passing statistics. His rushing ability forces defenses to stack the box, often opening play-action opportunities. Against Buffalo, he has faced defensive schemes focused on containment, limiting explosive runs but sometimes conceding mid-range passing gains.
Josh Allen Stats Snapshot
- Completion Percentage: Typically 64–69%
- Passing Yards per Game vs Ravens: Commonly 250–320 yards
- Rushing Contribution: 30–60 rushing yards
- Total Touchdowns (average matchup): 2–4 combined
Allen’s strong arm enables vertical attacks, particularly targeting deep sideline throws. Against Baltimore’s blitz-heavy defense, Allen’s mobility becomes crucial in extending plays and reducing sack totals.
Offensive Team Statistics
When analyzing overall offensive output, key data points provide insight into how each team performs.
Baltimore Ravens Offensive Trends
- Team Rushing Yards: Often 150–200+ yards in strong outings
- Yards per Carry: Around 4.5–5.5 yards
- Total Yards per Game: 350–400 in competitive matchups
- Third Down Conversion: Roughly 40–50%
The Ravens rely heavily on formation diversity, motion, and option concepts. When they surpass 150 rushing yards against Buffalo, their win probability increases significantly. Time of possession frequently tilts in their favor when their ground game succeeds.
Buffalo Bills Offensive Trends
- Team Passing Yards: Frequently 250–300+ yards
- Total Yards per Game: 375–425 in peak form
- Red Zone Efficiency: Approximately 55–65%
- Explosive Plays (20+ yards): 5–8 per game average
The Bills utilize spread formations, quick reads, and deep threat receivers. When their offensive line withstands Baltimore’s blitz pressure, their scoring output increases dramatically.
Defensive Performance Metrics
Both teams pride themselves on physical, strategic defense. Defensive stats often decide who controls game momentum.
Ravens Defensive Stats vs Bills
- Sacks per Game in Matchups: 2–4
- Blitz Rate: Among highest in NFL (often 30%+)
- Points Allowed: Typically 17–27 vs Buffalo
- Turnovers Forced: 1–2 average
Baltimore’s aggressive approach can generate pressure but occasionally leaves the secondary vulnerable to deep passes. Their ability to disguise coverages has historically caused issues for less experienced quarterbacks, though Allen has adapted well in recent encounters.
Bills Defensive Stats vs Ravens
- Points Allowed: Typically 20–28 vs Baltimore
- QB Hits: 5–9 per matchup
- Interceptions: 0–2 per matchup
- Run Defense: Often allows 120–180 rushing yards vs Ravens
The Bills’ defensive strategy typically emphasizes edge containment to reduce Jackson’s scramble opportunities. Linebacker discipline is critical in defending run-pass option plays.
Special Teams Impact
Special teams often play a pivotal statistical role in tightly contested Ravens vs Bills games.
- Field Goal Accuracy: Frequently above 85% for both teams
- Punt Net Average: 42–48 yards
- Kick Return Average: 20–25 yards
Baltimore traditionally boasts elite kicking reliability, translating into crucial late-game points. Buffalo’s return units occasionally provide advantageous field position, shifting momentum.
Key Statistical Patterns in Recent Matchups
Recent meetings between the Ravens and Bills reveal repeating statistical themes:
- Turnover Margin is Decisive: The team winning the turnover battle has won most recent encounters.
- Quarterback Rushing Matters: Combined QB rushing yards often exceed 80 yards between Allen and Jackson.
- Limited Big Plays Allowed: Defenses attempt to eliminate 40+ yard gains.
- Fourth Quarter Scoring: Many points are scored late, indicating close contests.
Games often remain within one possession entering the fourth quarter, heightening the importance of clutch performance statistics such as third-and-long conversion rates and red zone defense.

Playoff Implications and Postseason Stats
The Ravens and Bills have also met in postseason competition, where statistical margins become even slimmer. In playoff contexts, both teams average slightly lower scoring totals due to intensified defensive execution.
Key postseason statistical differences include:
- Lower yards per play averages
- More conservative offensive play calling early in games
- Higher punt frequency
- Greater reliance on defensive stops
Quarterback efficiency rating becomes the defining metric in playoff matchups. A single interception or failed fourth-down attempt has historically shifted postseason outcomes between these teams.
Advanced Metrics and Analytics
Modern analysis goes beyond basic yardage. Advanced metrics reveal nuanced insights into Ravens vs Bills games.
- Expected Points Added (EPA): Quarterback scramble efficiency significantly boosts offensive EPA.
- Success Rate: Balanced offenses with 45%+ success rates generally prevail.
- Pressure Rate: When Baltimore pressures Allen above 35%, his completion percentage typically drops.
- Man vs Zone Splits: Both quarterbacks show greater efficiency against zone coverage.
Data suggests that whichever team controls early down efficiency often dictates defensive adjustments for the remainder of the game.
Conclusion
The Baltimore Ravens vs Buffalo Bills match stats consistently highlight a clash of contrasting offensive philosophies and aggressive defensive schemes. While Buffalo emphasizes vertical passing and explosive plays, Baltimore leans on dynamic rushing and strategic blitzing. Statistical indicators such as turnover margin, quarterback rushing contribution, and red zone efficiency frequently determine the outcome.
As both franchises continue to contend for AFC dominance, future matchups promise more tightly contested games filled with elite statistical performances. Whether through aerial fireworks or ground-game dominance, Ravens vs Bills remains one of the NFL’s most analytically intriguing showdowns.
FAQ: Baltimore Ravens vs Buffalo Bills Match Stats
- 1. Who usually has more passing yards in Ravens vs Bills games?
The Buffalo Bills typically record more passing yards due to their pass-heavy offensive system led by Josh Allen. - 2. How important is Lamar Jackson’s rushing performance?
Jackson’s rushing yards significantly impact Baltimore’s success. When he exceeds 60 rushing yards, the Ravens’ win probability increases. - 3. What defensive stat most influences the outcome?
Turnover margin is the most decisive factor. Teams winning the turnover battle often secure victory. - 4. Are these games usually high-scoring?
Scores vary, but many matchups fall within the 20–30 point range per team, especially in competitive seasons. - 5. How do playoff games differ statistically?
Playoff games feature tighter defensive play, fewer explosive plays, and lower overall scoring compared to regular-season matchups. - 6. Which team performs better on third down?
Both perform efficiently, but the team converting above 45% on third down typically gains the advantage. - 7. Do special teams play a significant role?
Yes, field goal accuracy and punting field position often influence close games between these teams.